

- Create an initial golden dataset to measure performance
- Define metrics to use to measure performance
- Run evaluations on a few different prompts or models
- Compare results manually
- Track results over time
- Set up automated testing to run in CI/CD
Setup
First install the required dependencies for this tutorial. We happen to use OpenAI, but LangSmith can be used with any model:Create a dataset
The first step when getting ready to test and evaluate your application is to define the datapoints you want to evaluate. There are a few aspects to consider here:- What should the schema of each datapoint be?
- How many datapoints should I gather?
- How should I gather those datapoints?
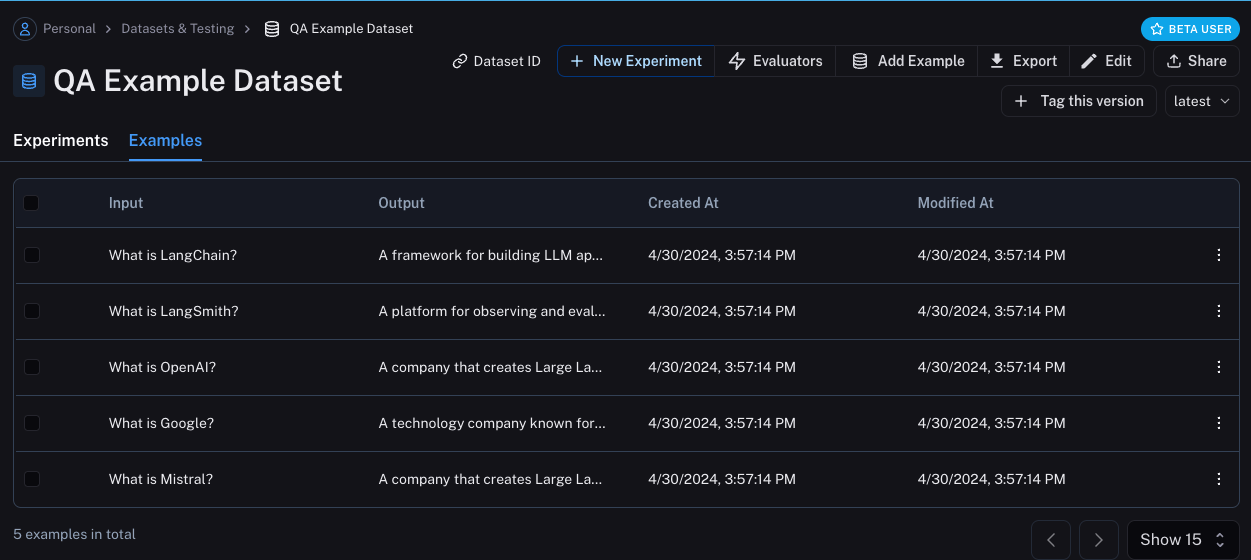
QA Example Dataset in the Datasets & Testing page, when we click into it we should see that we have five new examples.
Define metrics
After creating our dataset, we can now define some metrics to evaluate our responses on. Since we have an expected answer, we can compare to that as part of our evaluation. However, we do not expect our application to output those exact answers, but rather something that is similar. This makes our evaluation a little trickier. In addition to evaluating correctness, let’s also make sure our answers are short and concise. This will be a little easier - we can define a simple Python function to measure the length of the response. Let’s go ahead and define these two metrics. For the first, we will use an LLM to judge whether the output is correct (with respect to the expected output). This LLM-as-a-judge is relatively common for cases that are too complex to measure with a simple function. We can define our own prompt and LLM to use for evaluation here:Run evaluations
Great! Now how do we run evaluations? Now that we have a dataset and evaluators, all that we need is our application! We will build a simple application that just has a system message with instructions on how to respond and then passes it to the LLM. We will build this using the OpenAI SDK directly: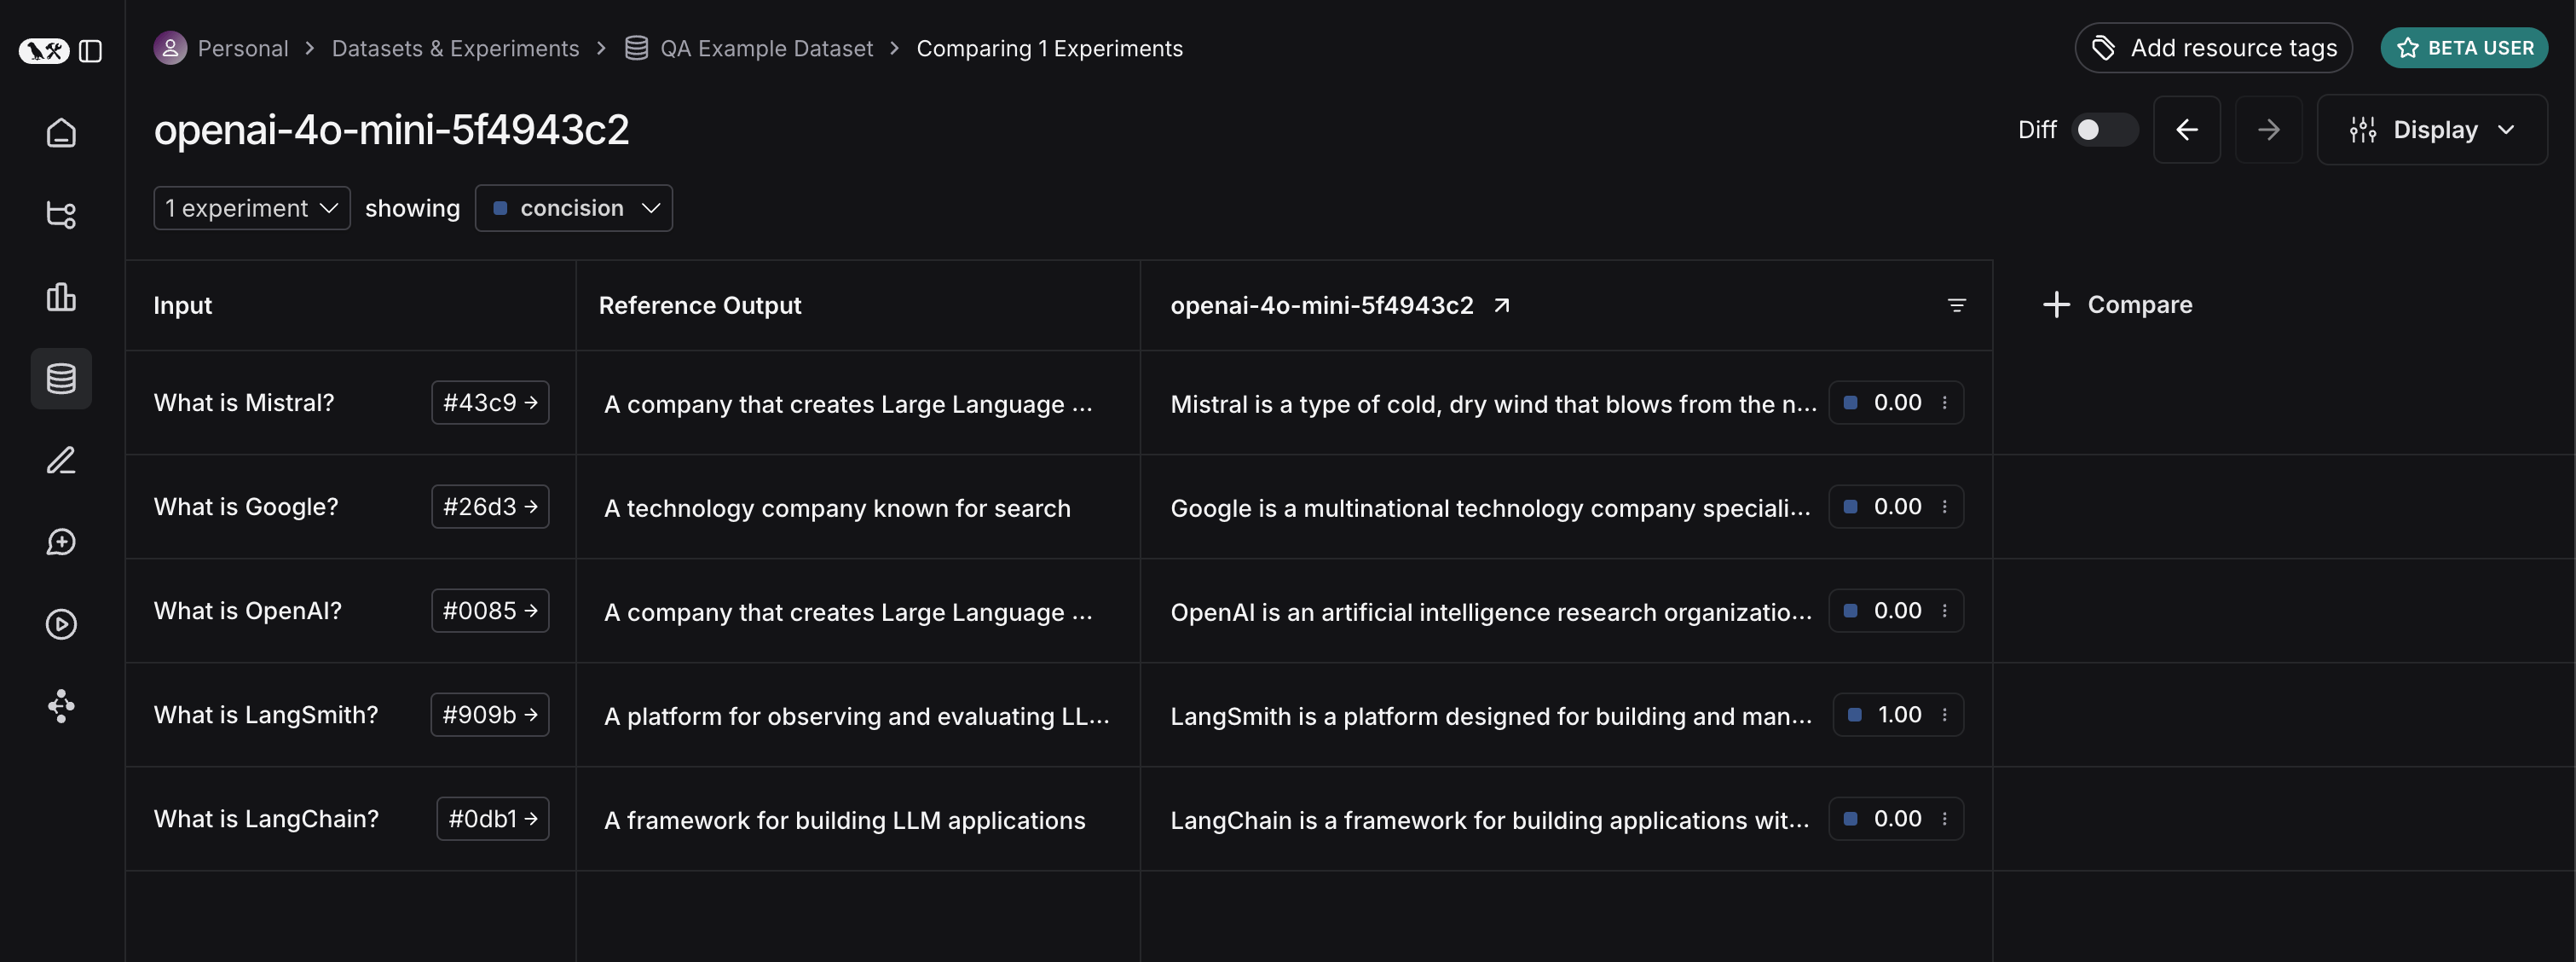
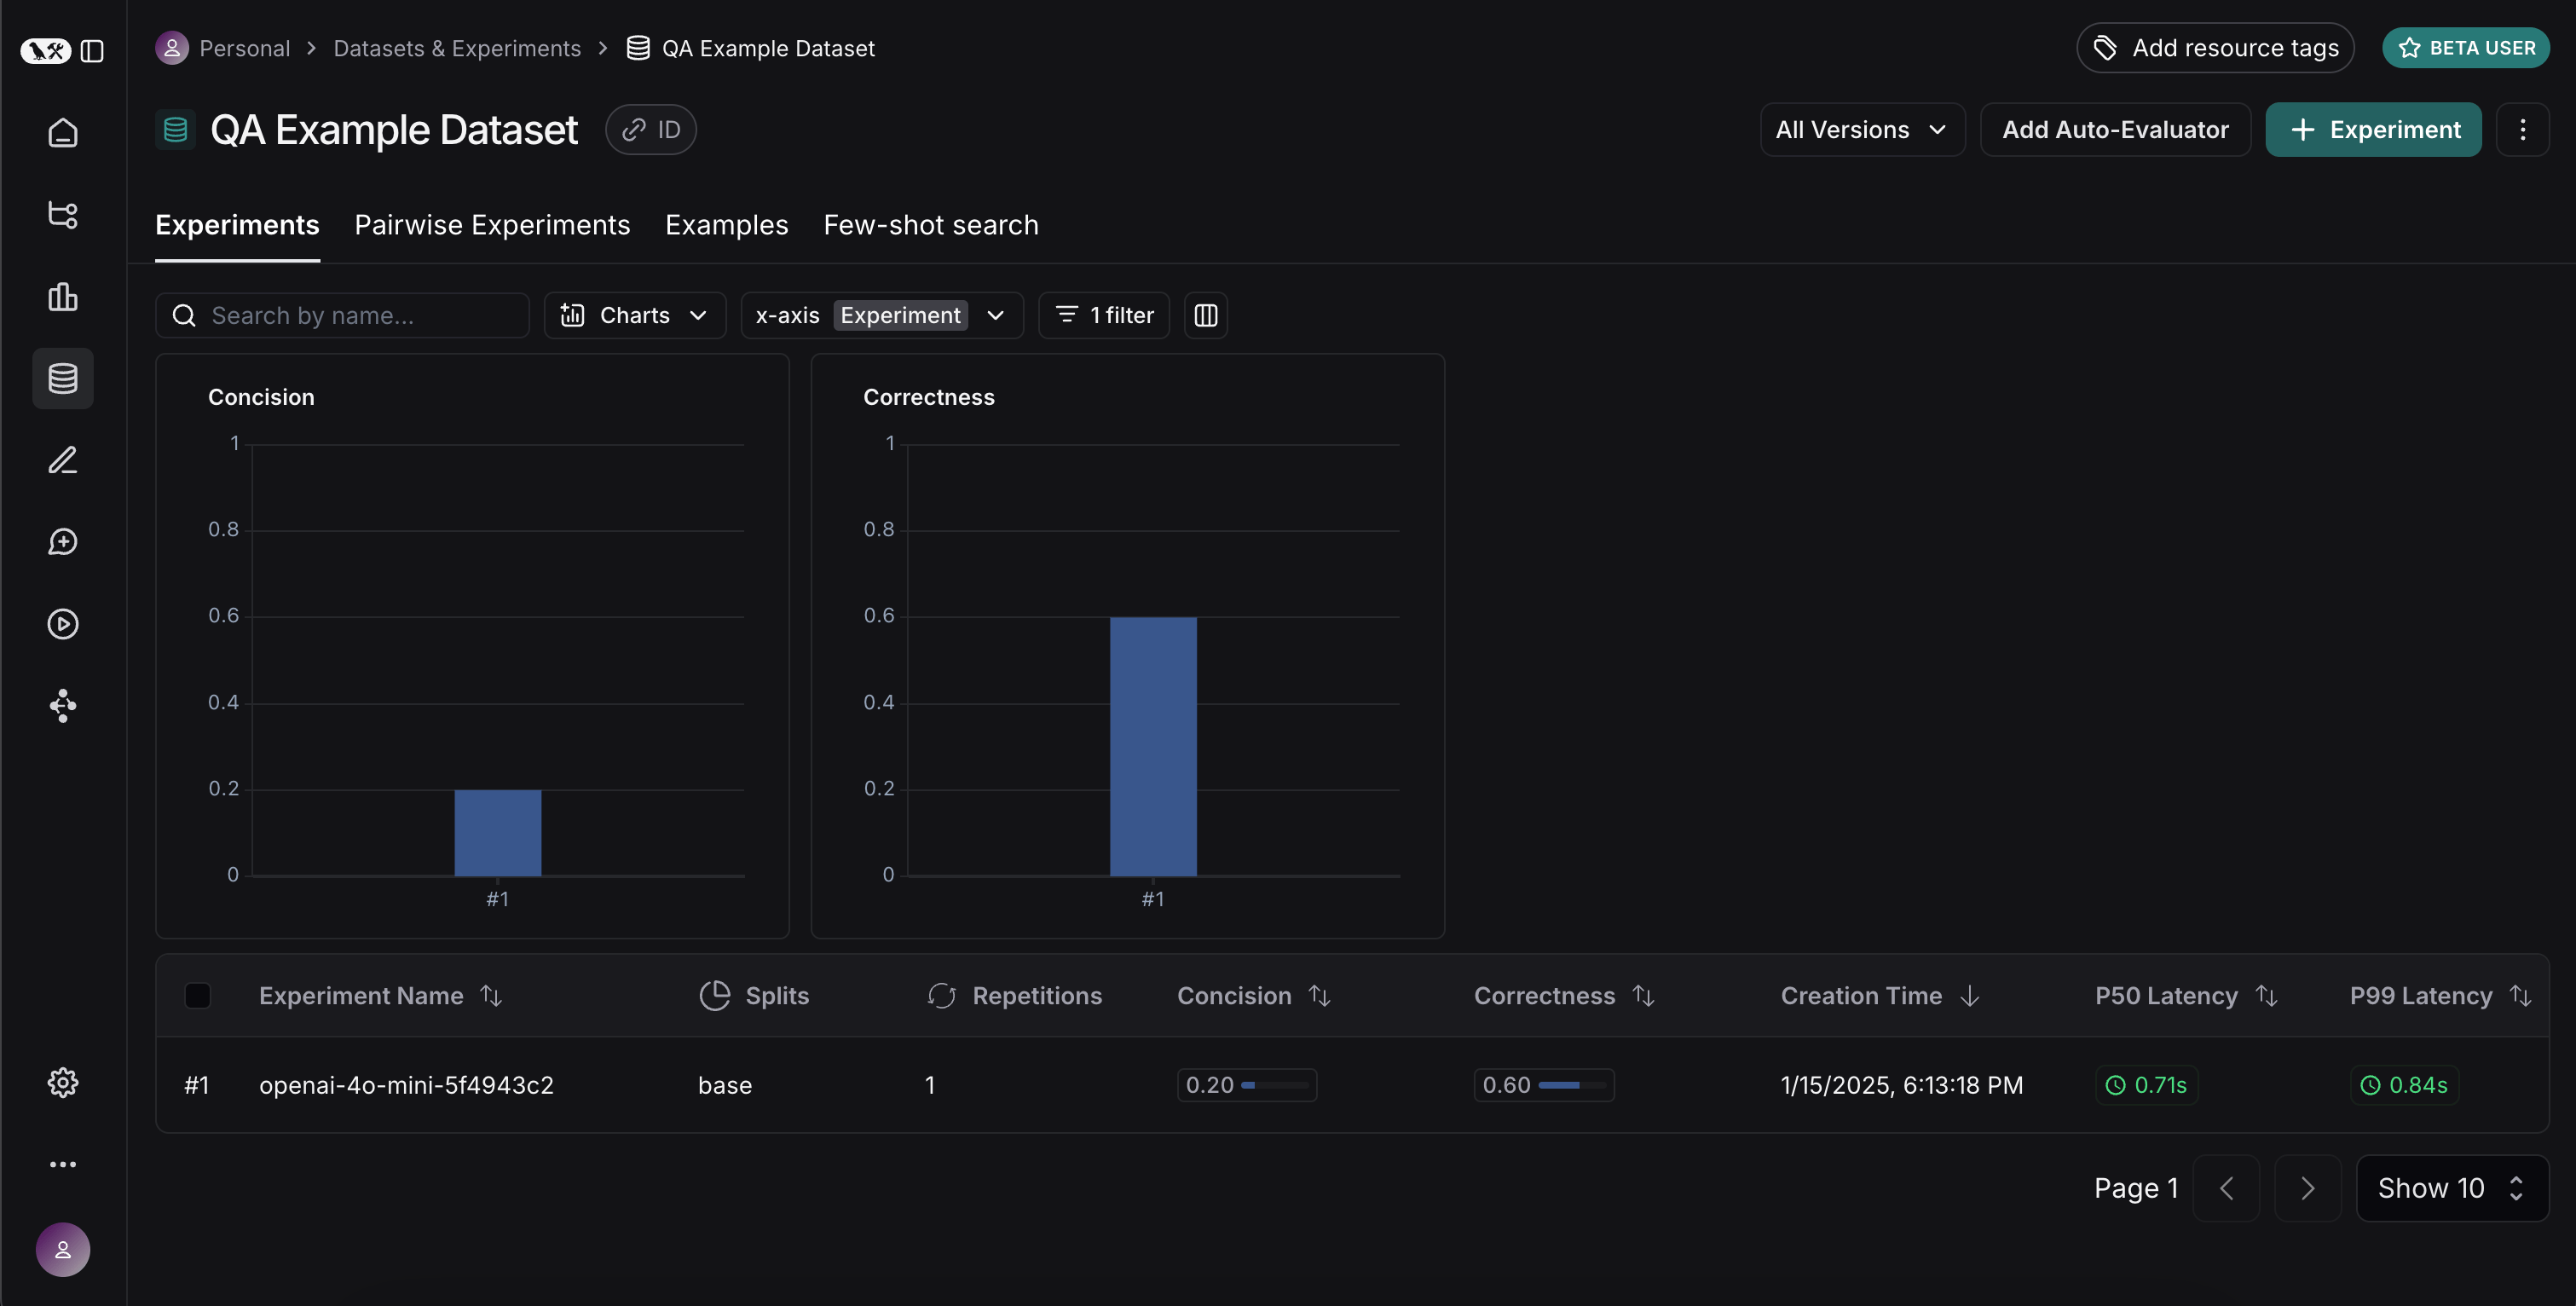
Experiments tab, we can now see a summary of our one run!
gpt-4-turbo
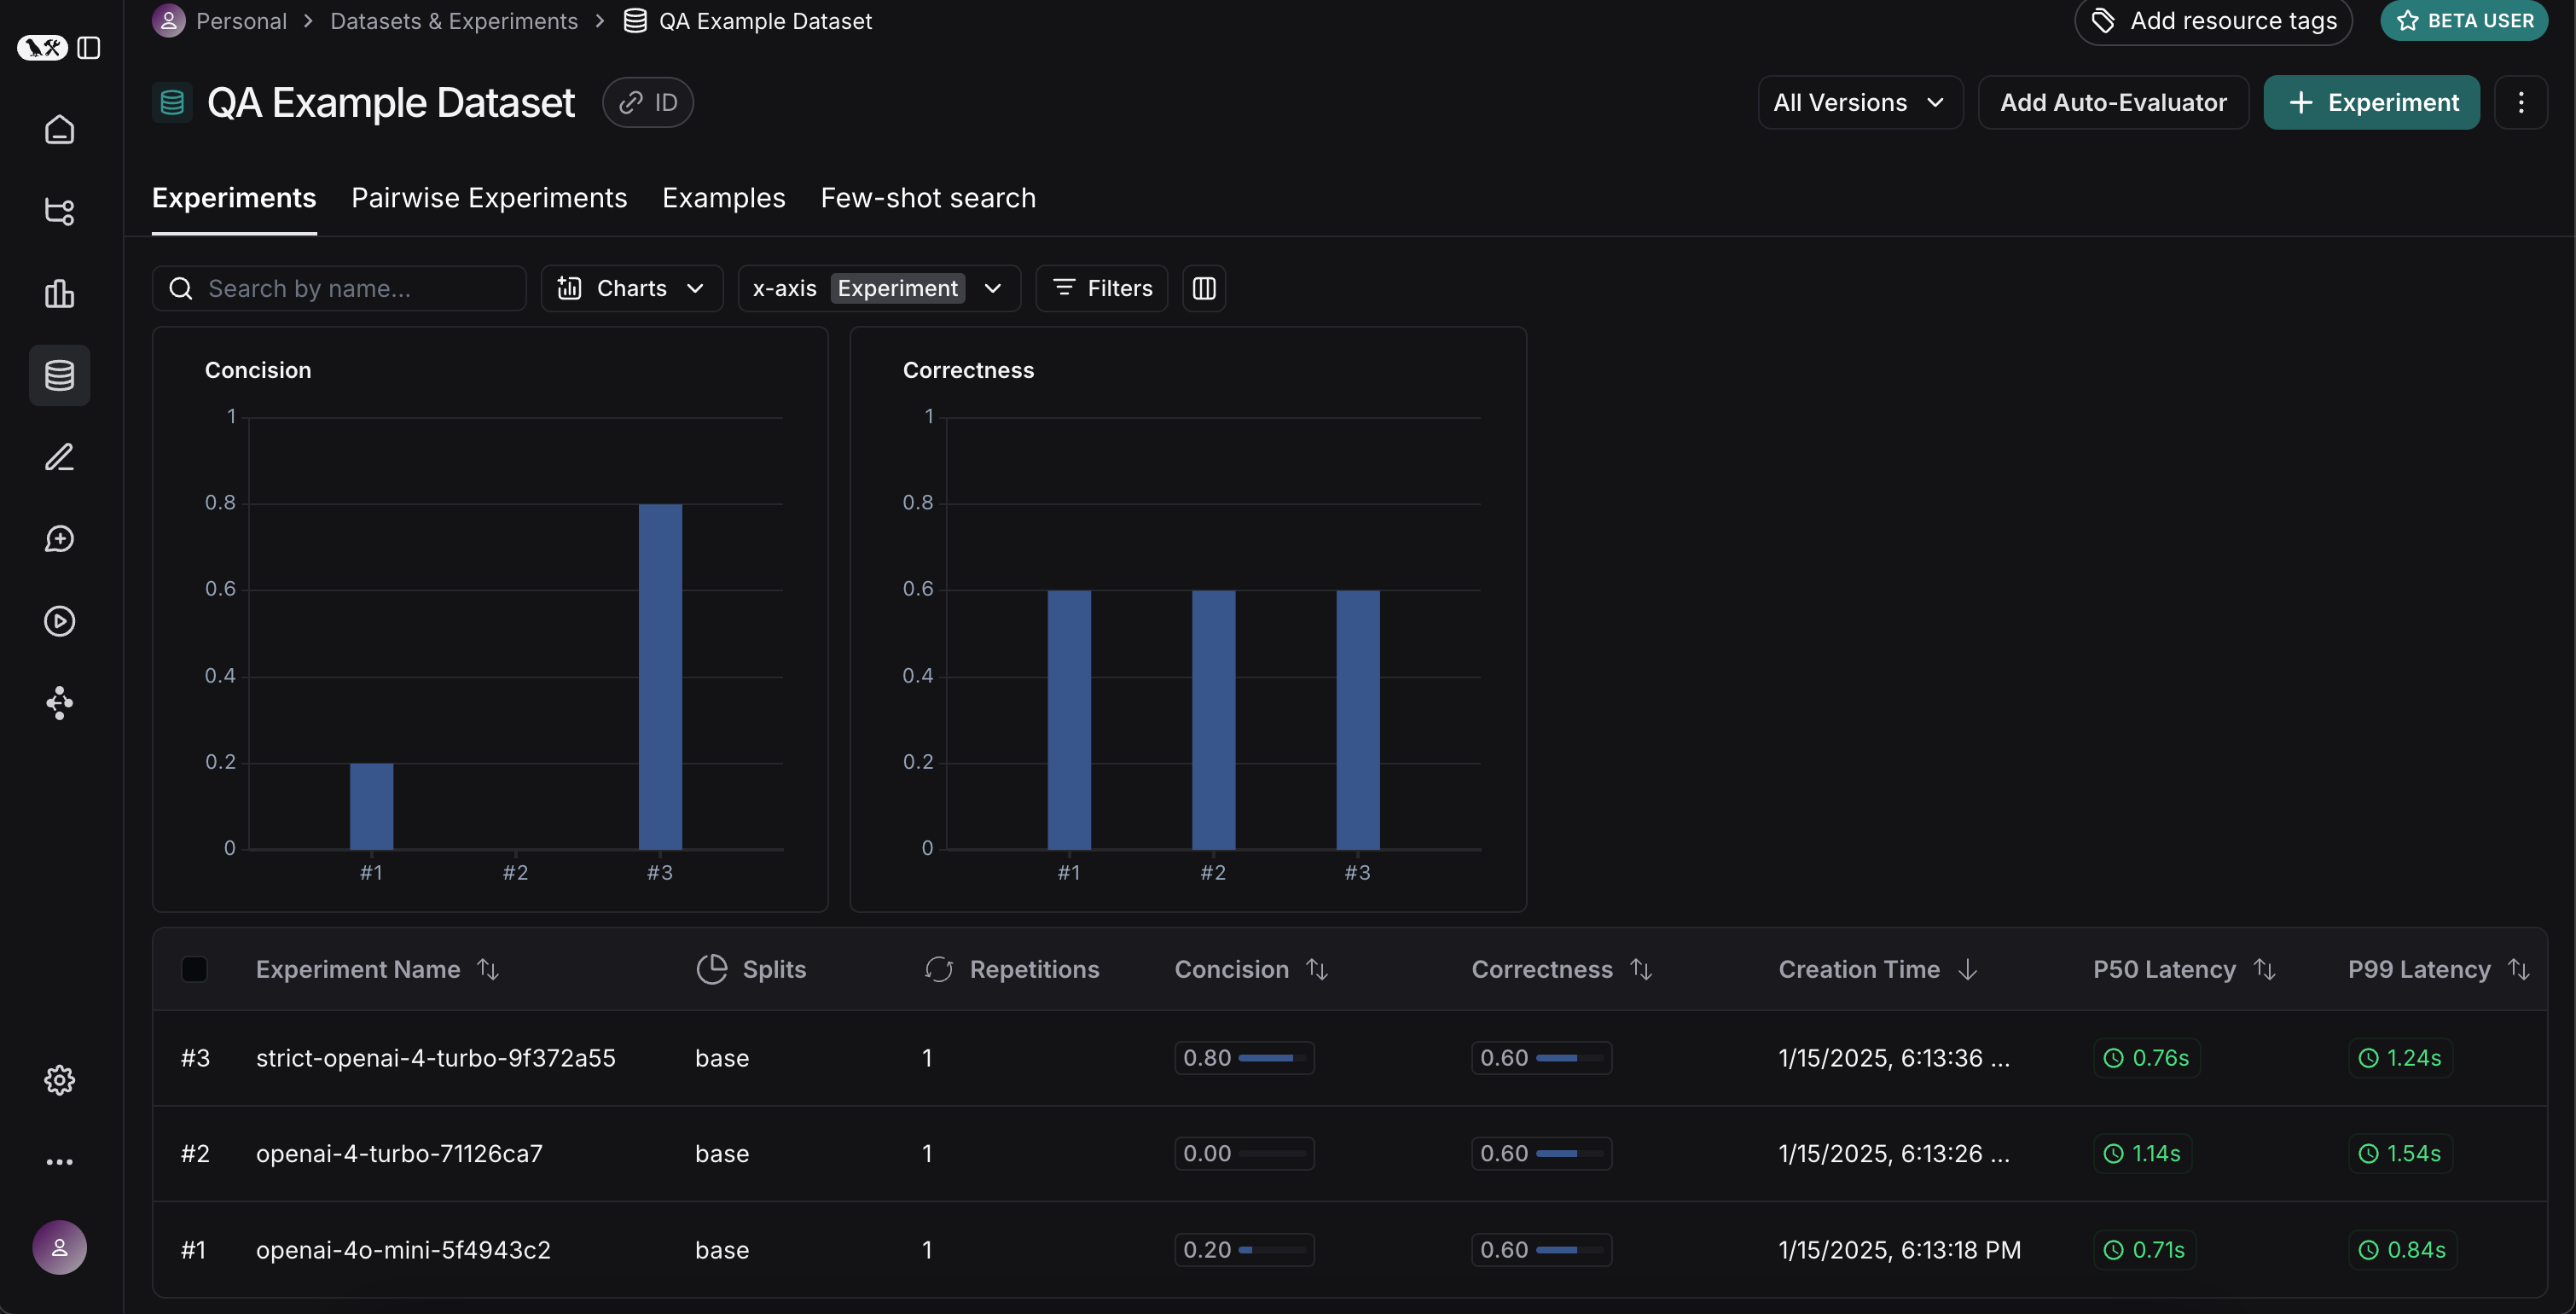
Experiments tab on the datasets page, we should see that all three runs now show up!
Comparing results
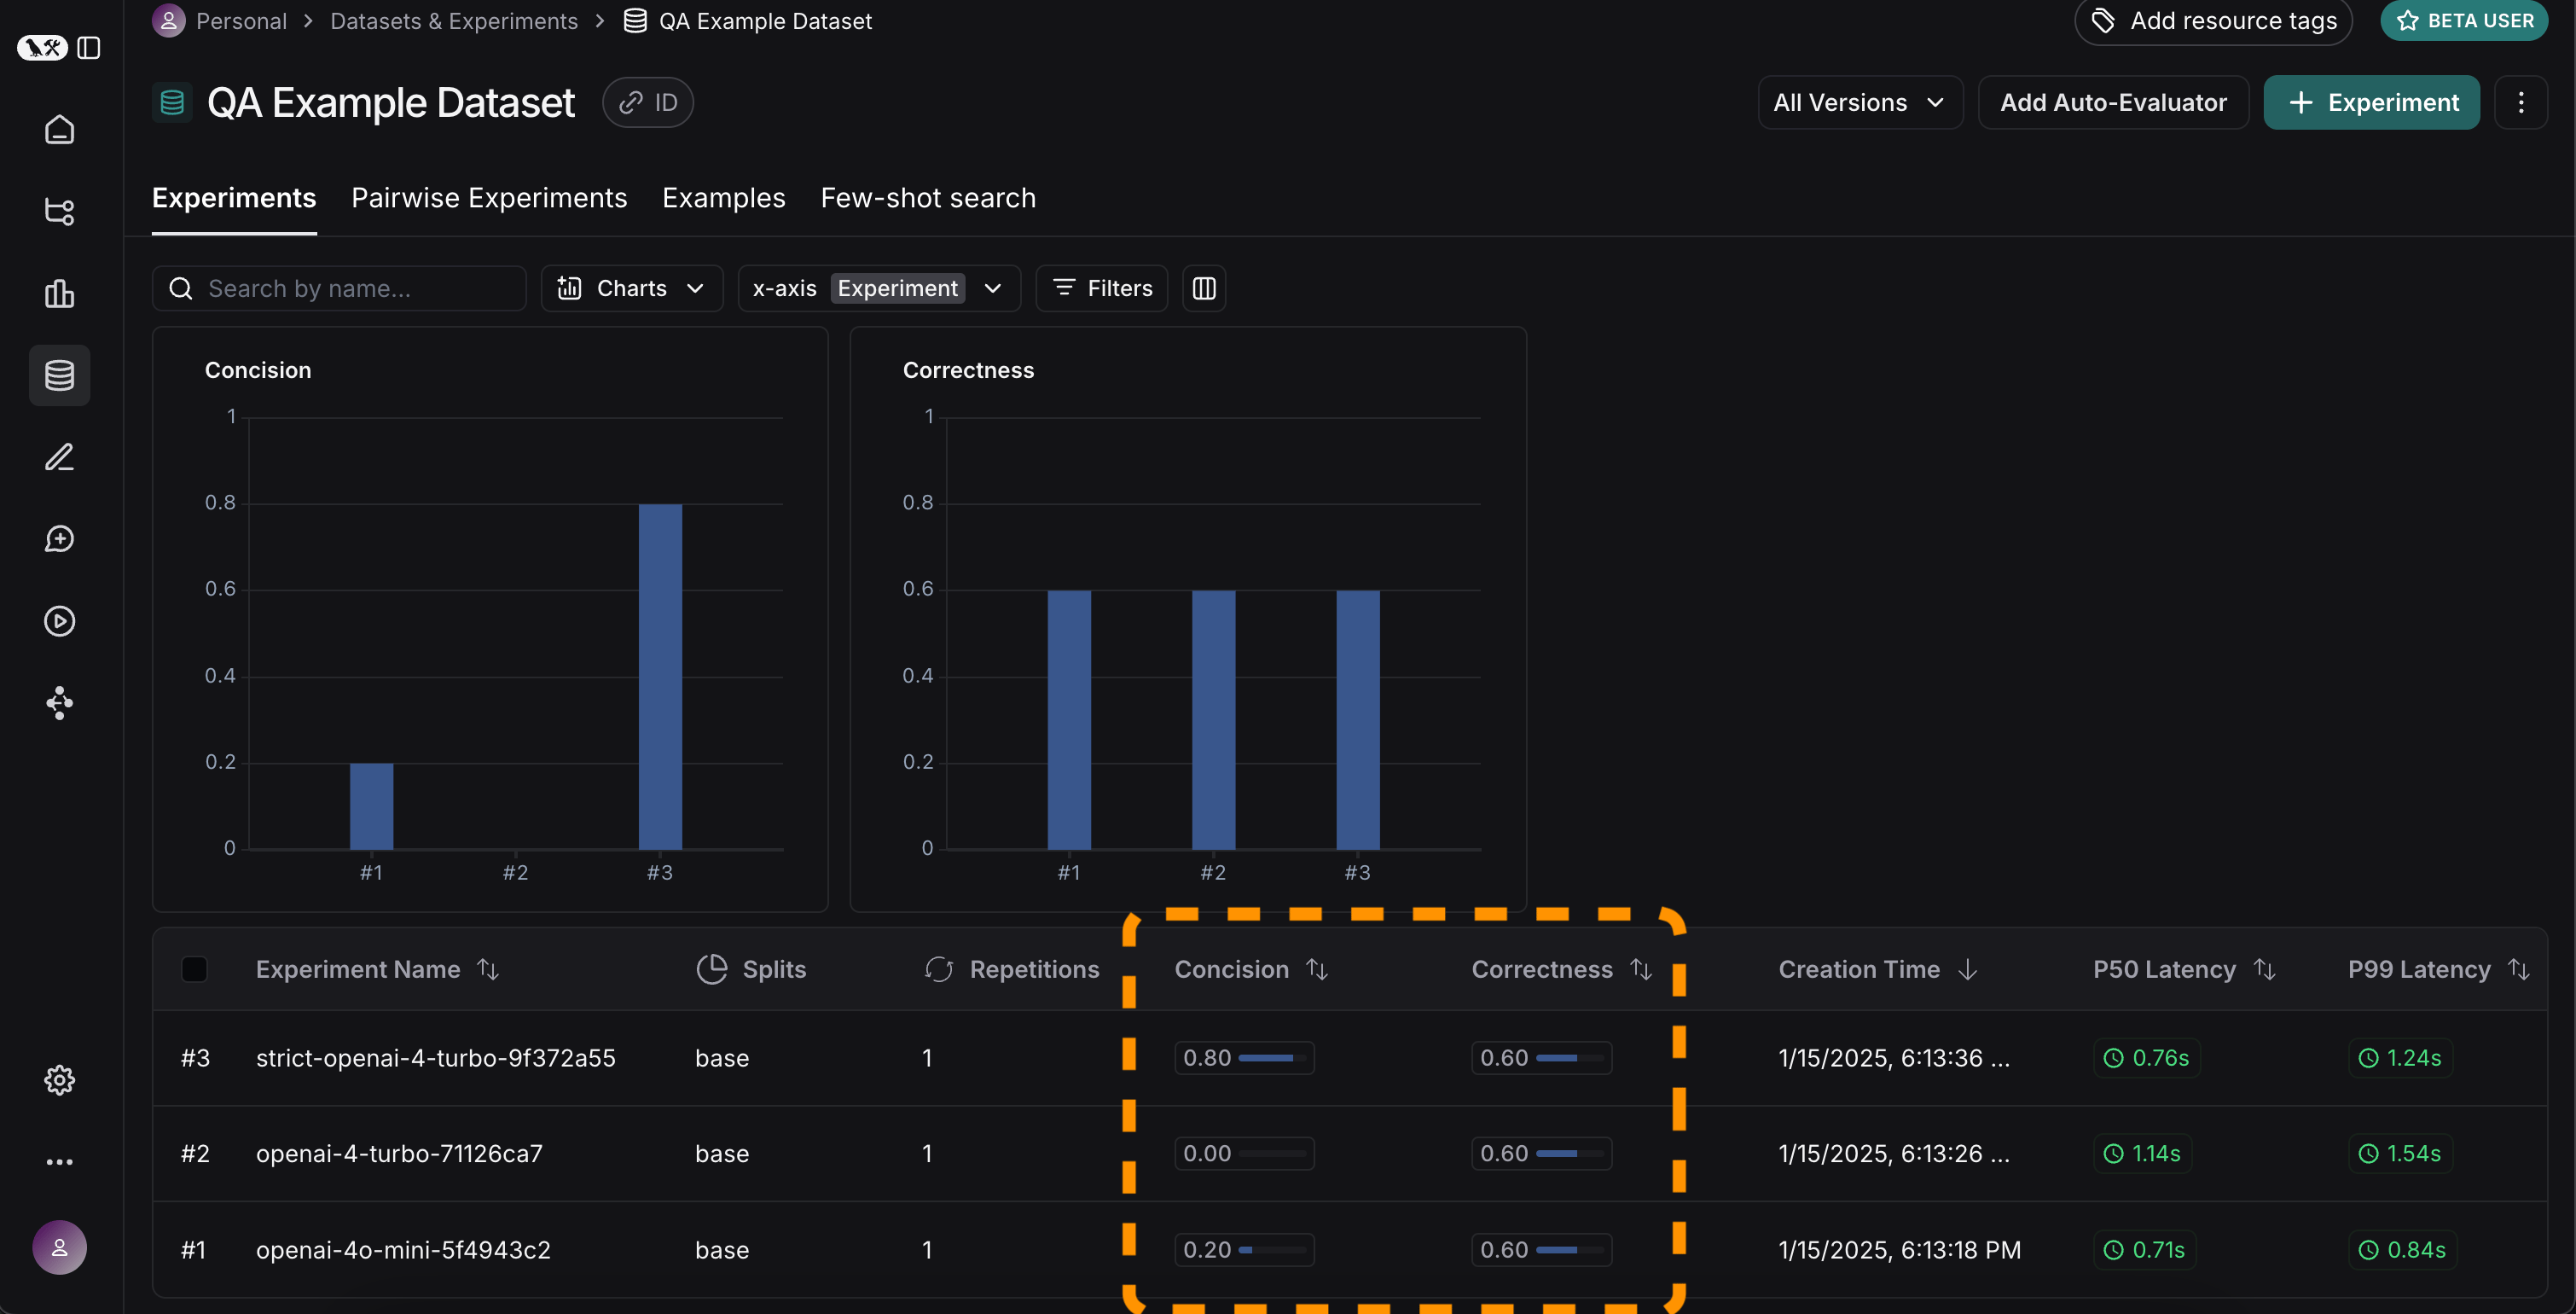
Awesome, we’ve evaluated three different runs. But how can we compare results? The first way we can do this is just by looking at the runs in theExperiments tab. If we do that, we can see a high level view of the metrics for each run:
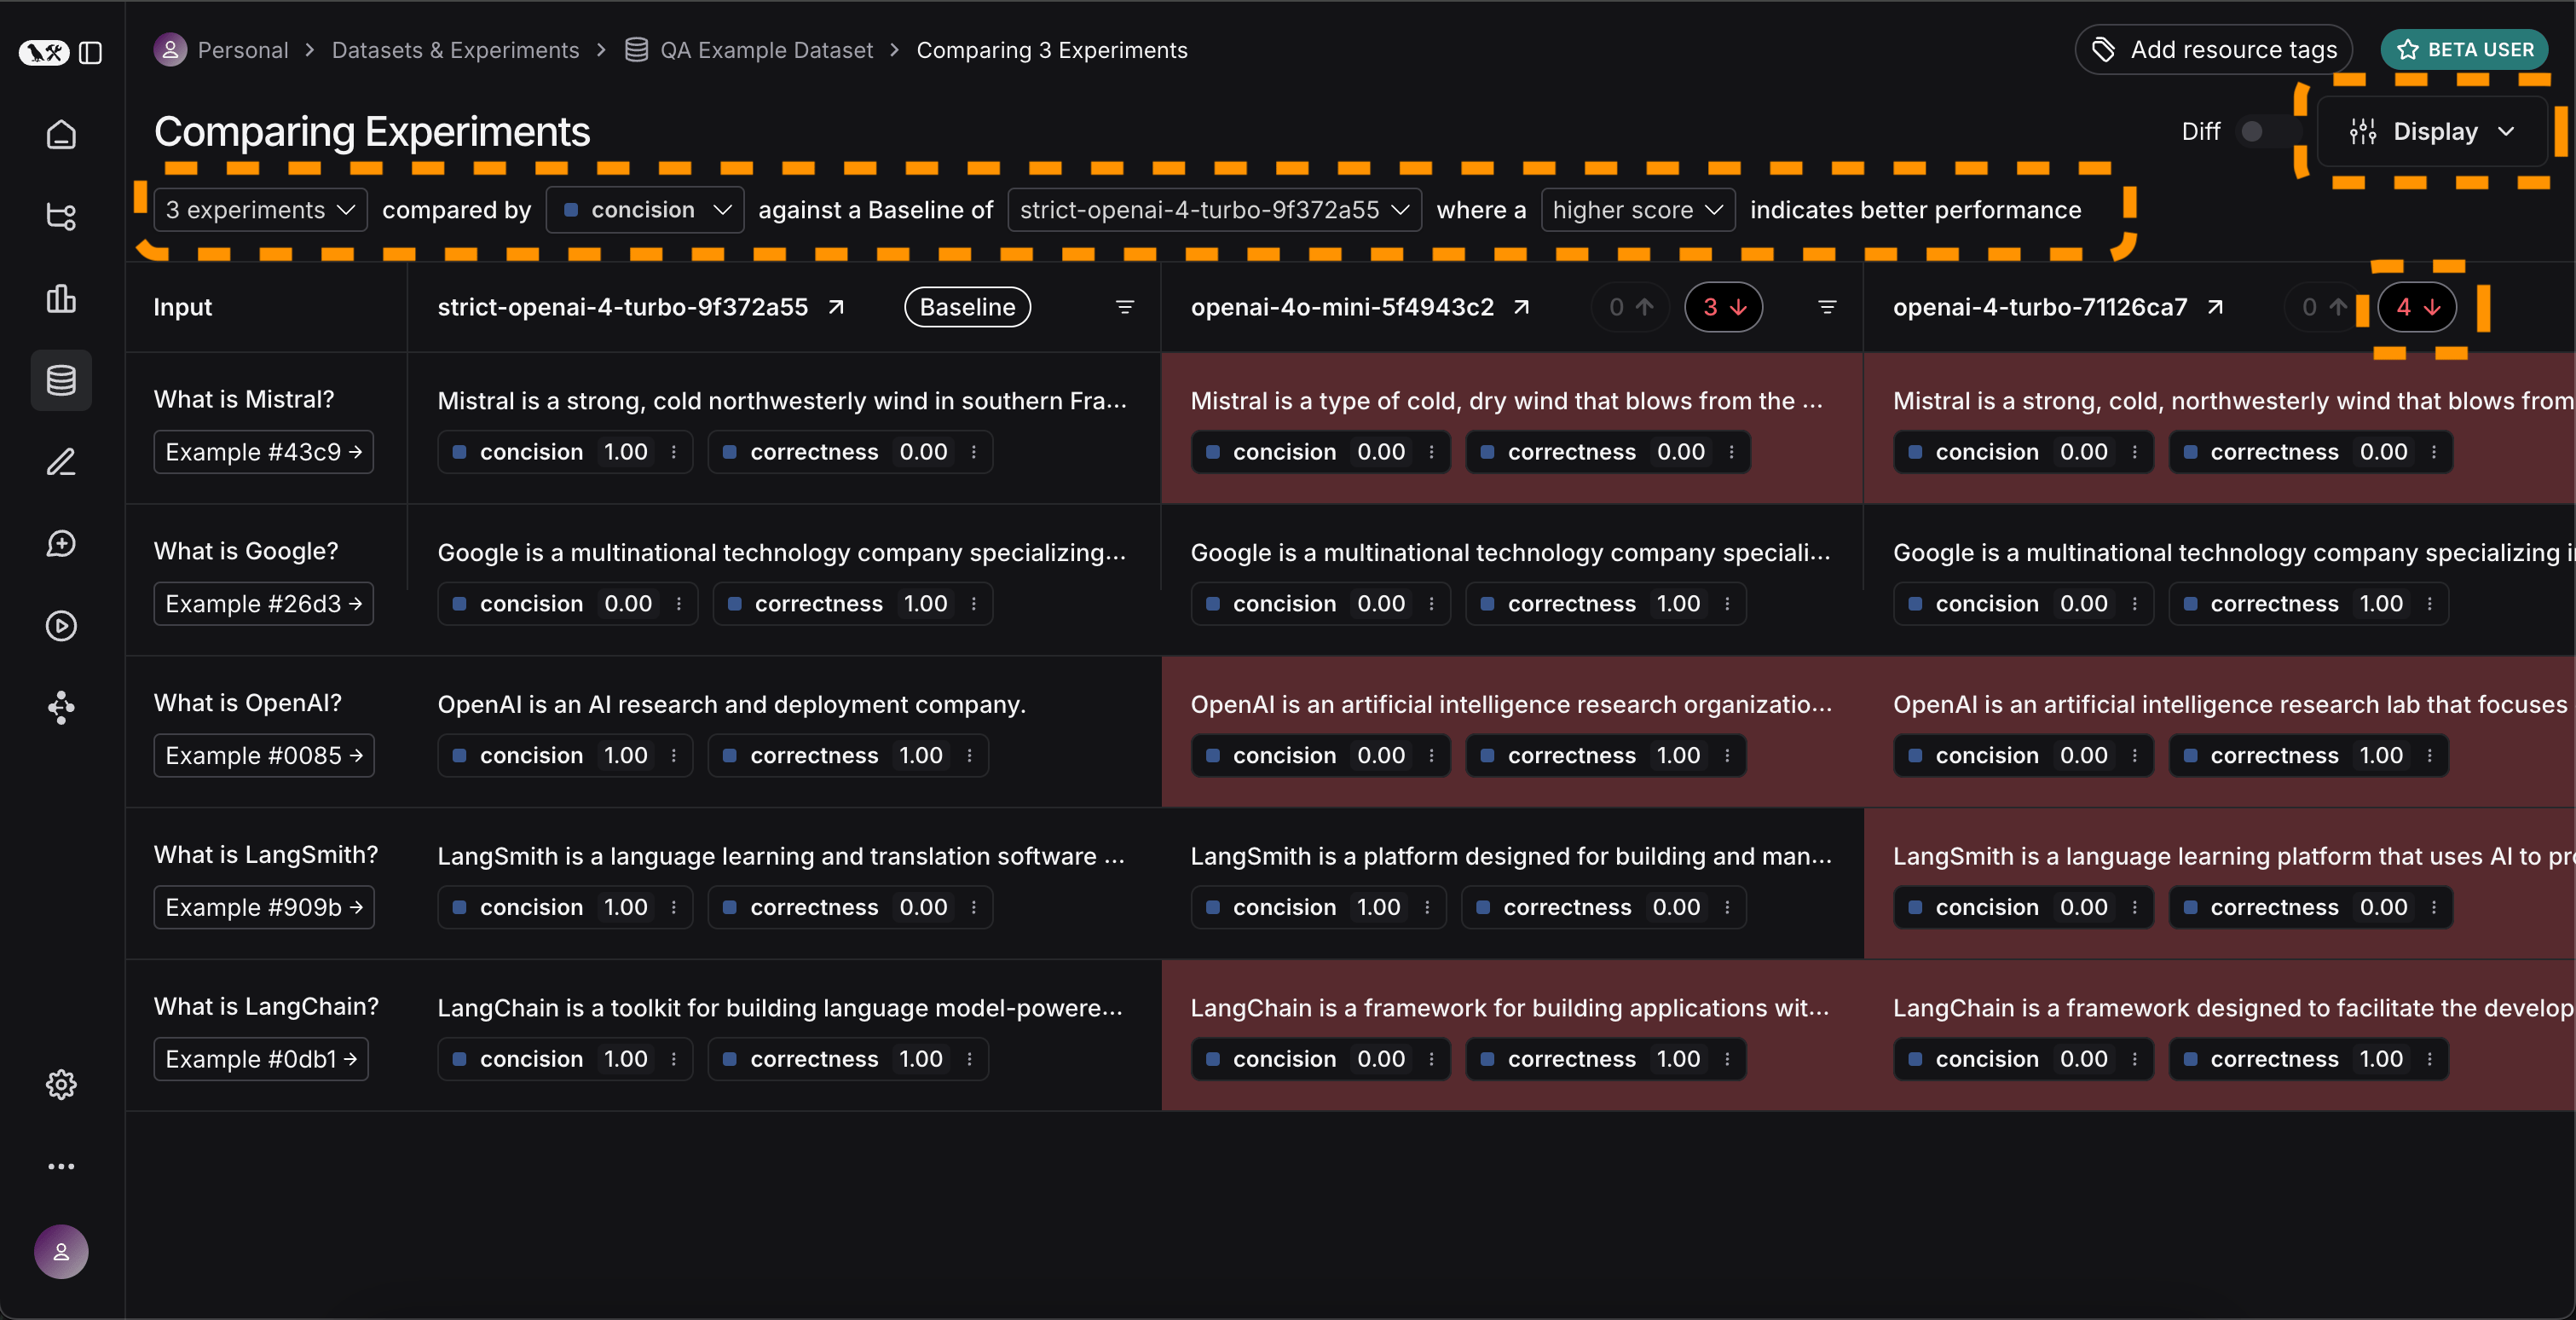
Display control. You can also automatically filter to only see the runs that have improvements/regressions by clicking on the icons at the top.
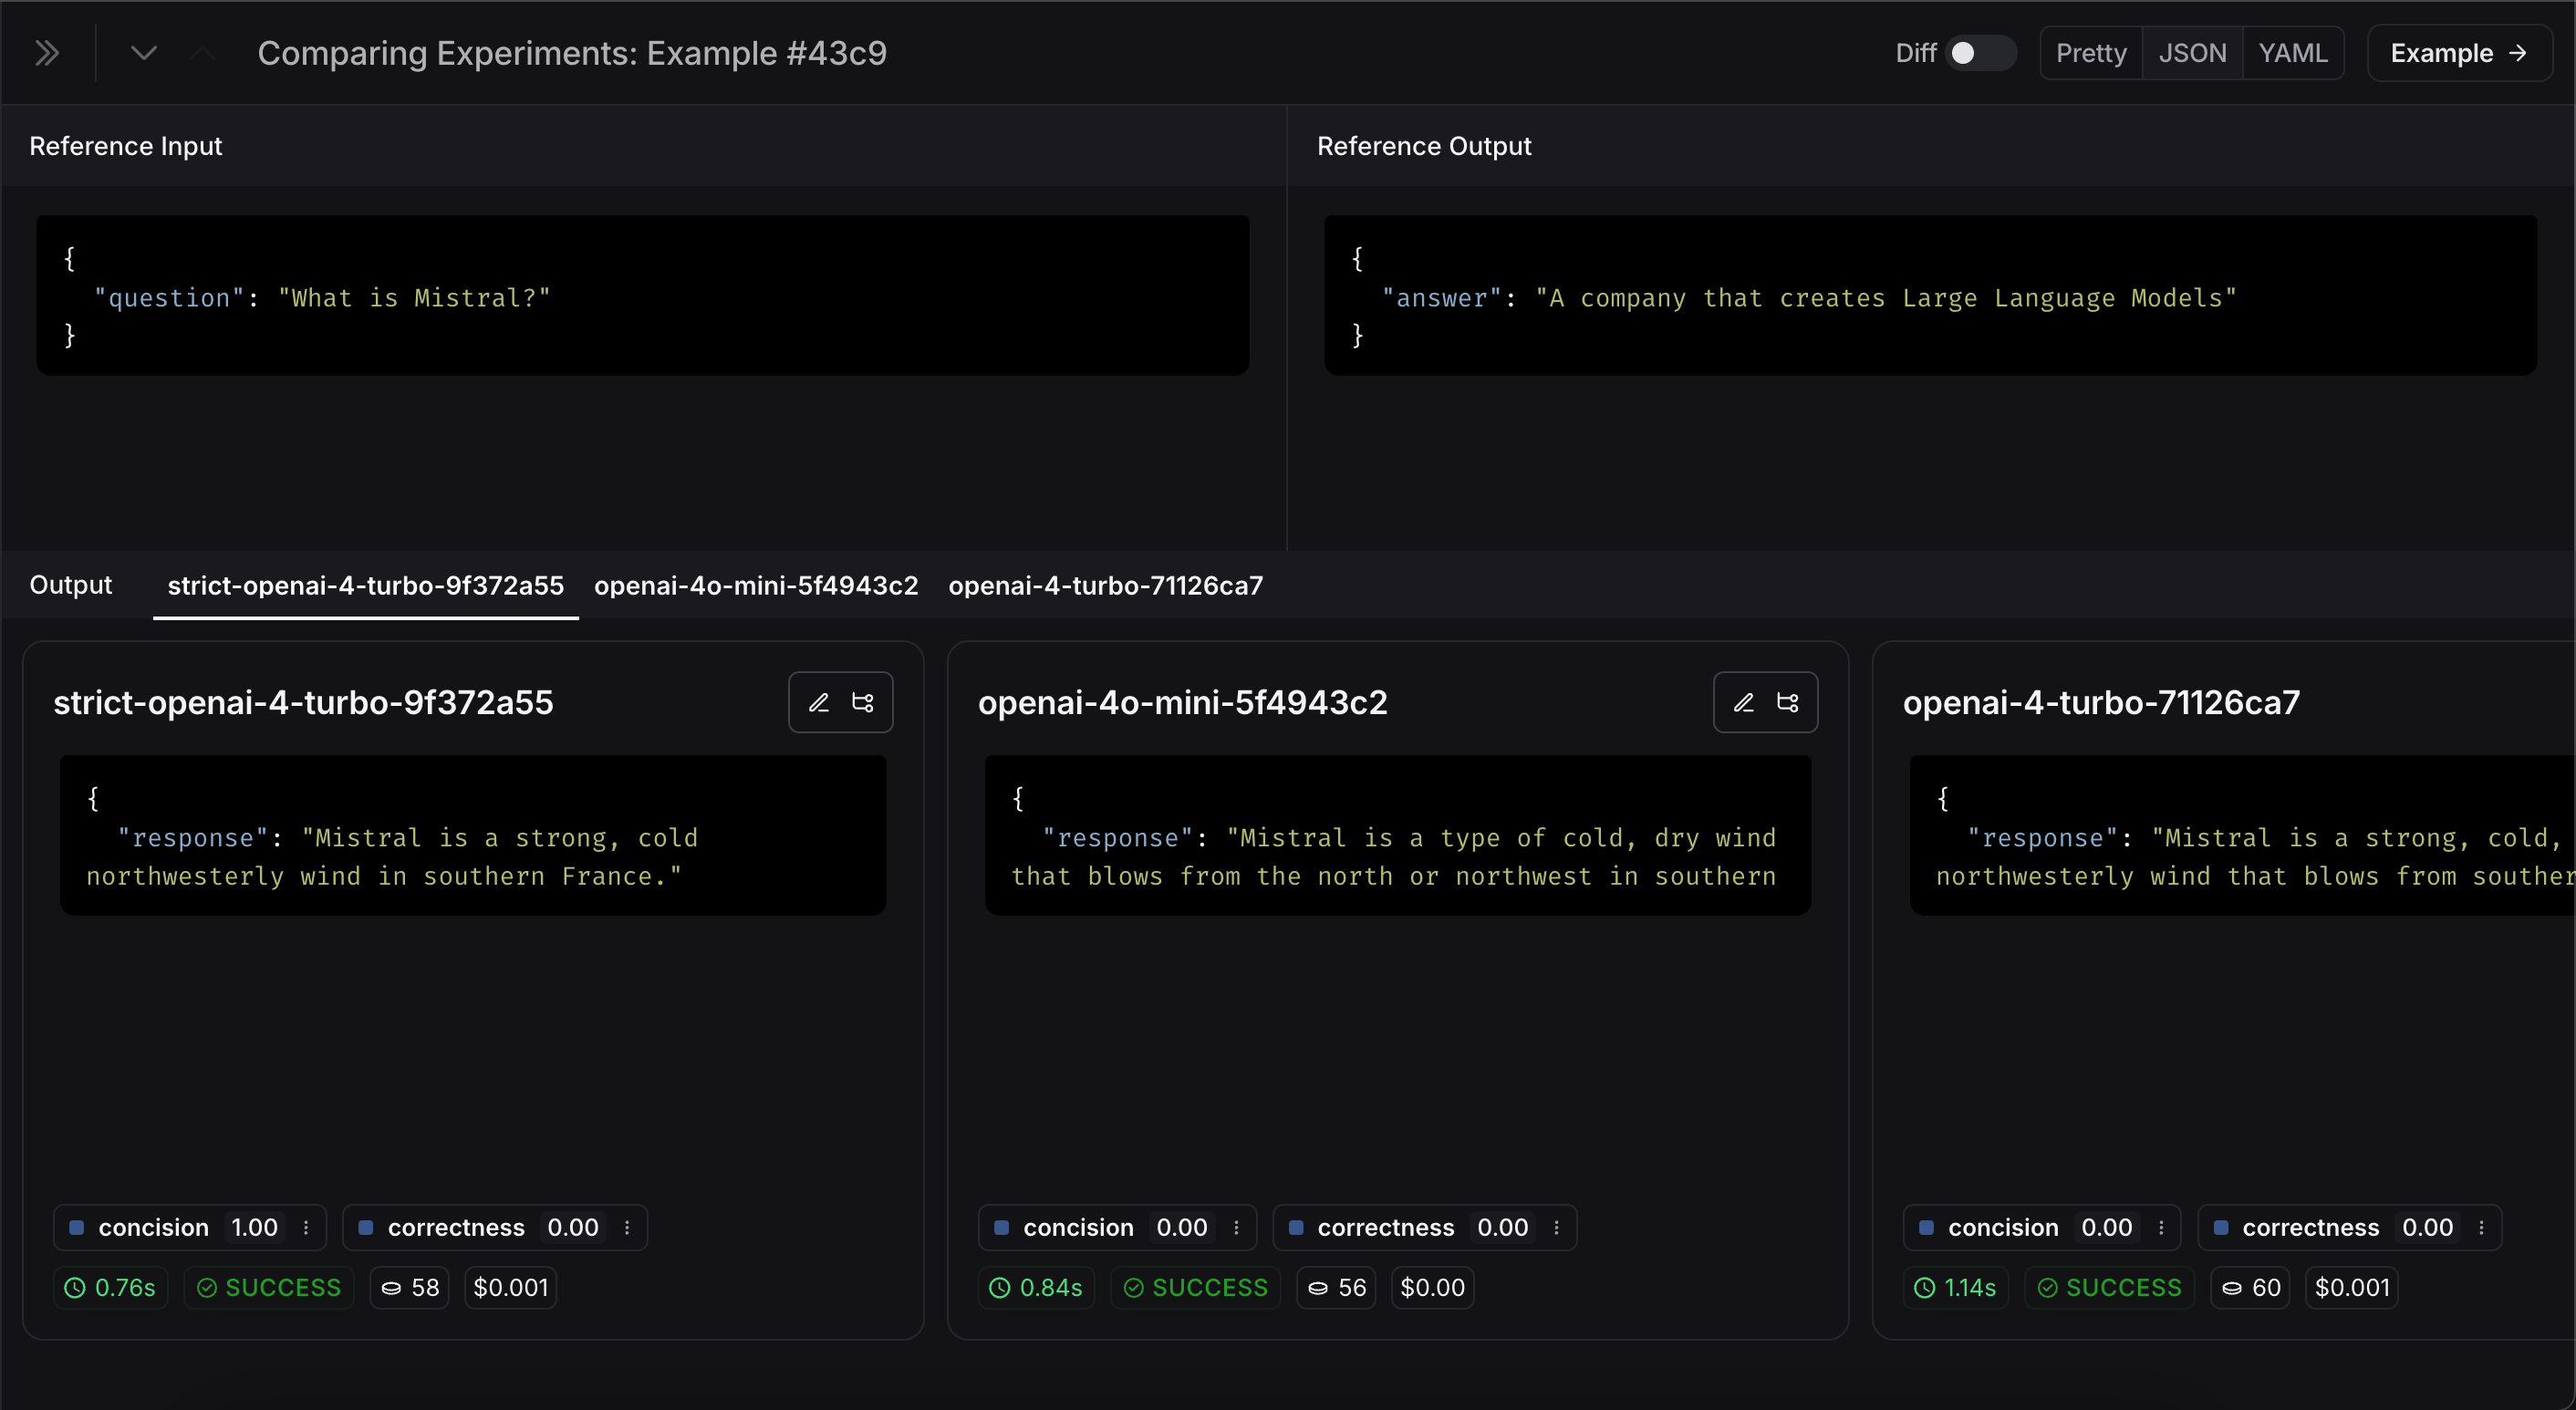
Expand button that appears when hovering over a row to open up a side panel with more detailed information:
Set up automated testing to run in CI/CD
Now that we’ve run this in a one-off manner, we can set it to run in an automated fashion. We can do this pretty easily by just including it as a pytest file that we run in CI/CD. As part of this, we can either just log the results OR set up some criteria to determine if it passes or not. For example, if I wanted to ensure that we always got at least 80% of generated responses passing thelength check, we could set that up with a test like:
Track results over time
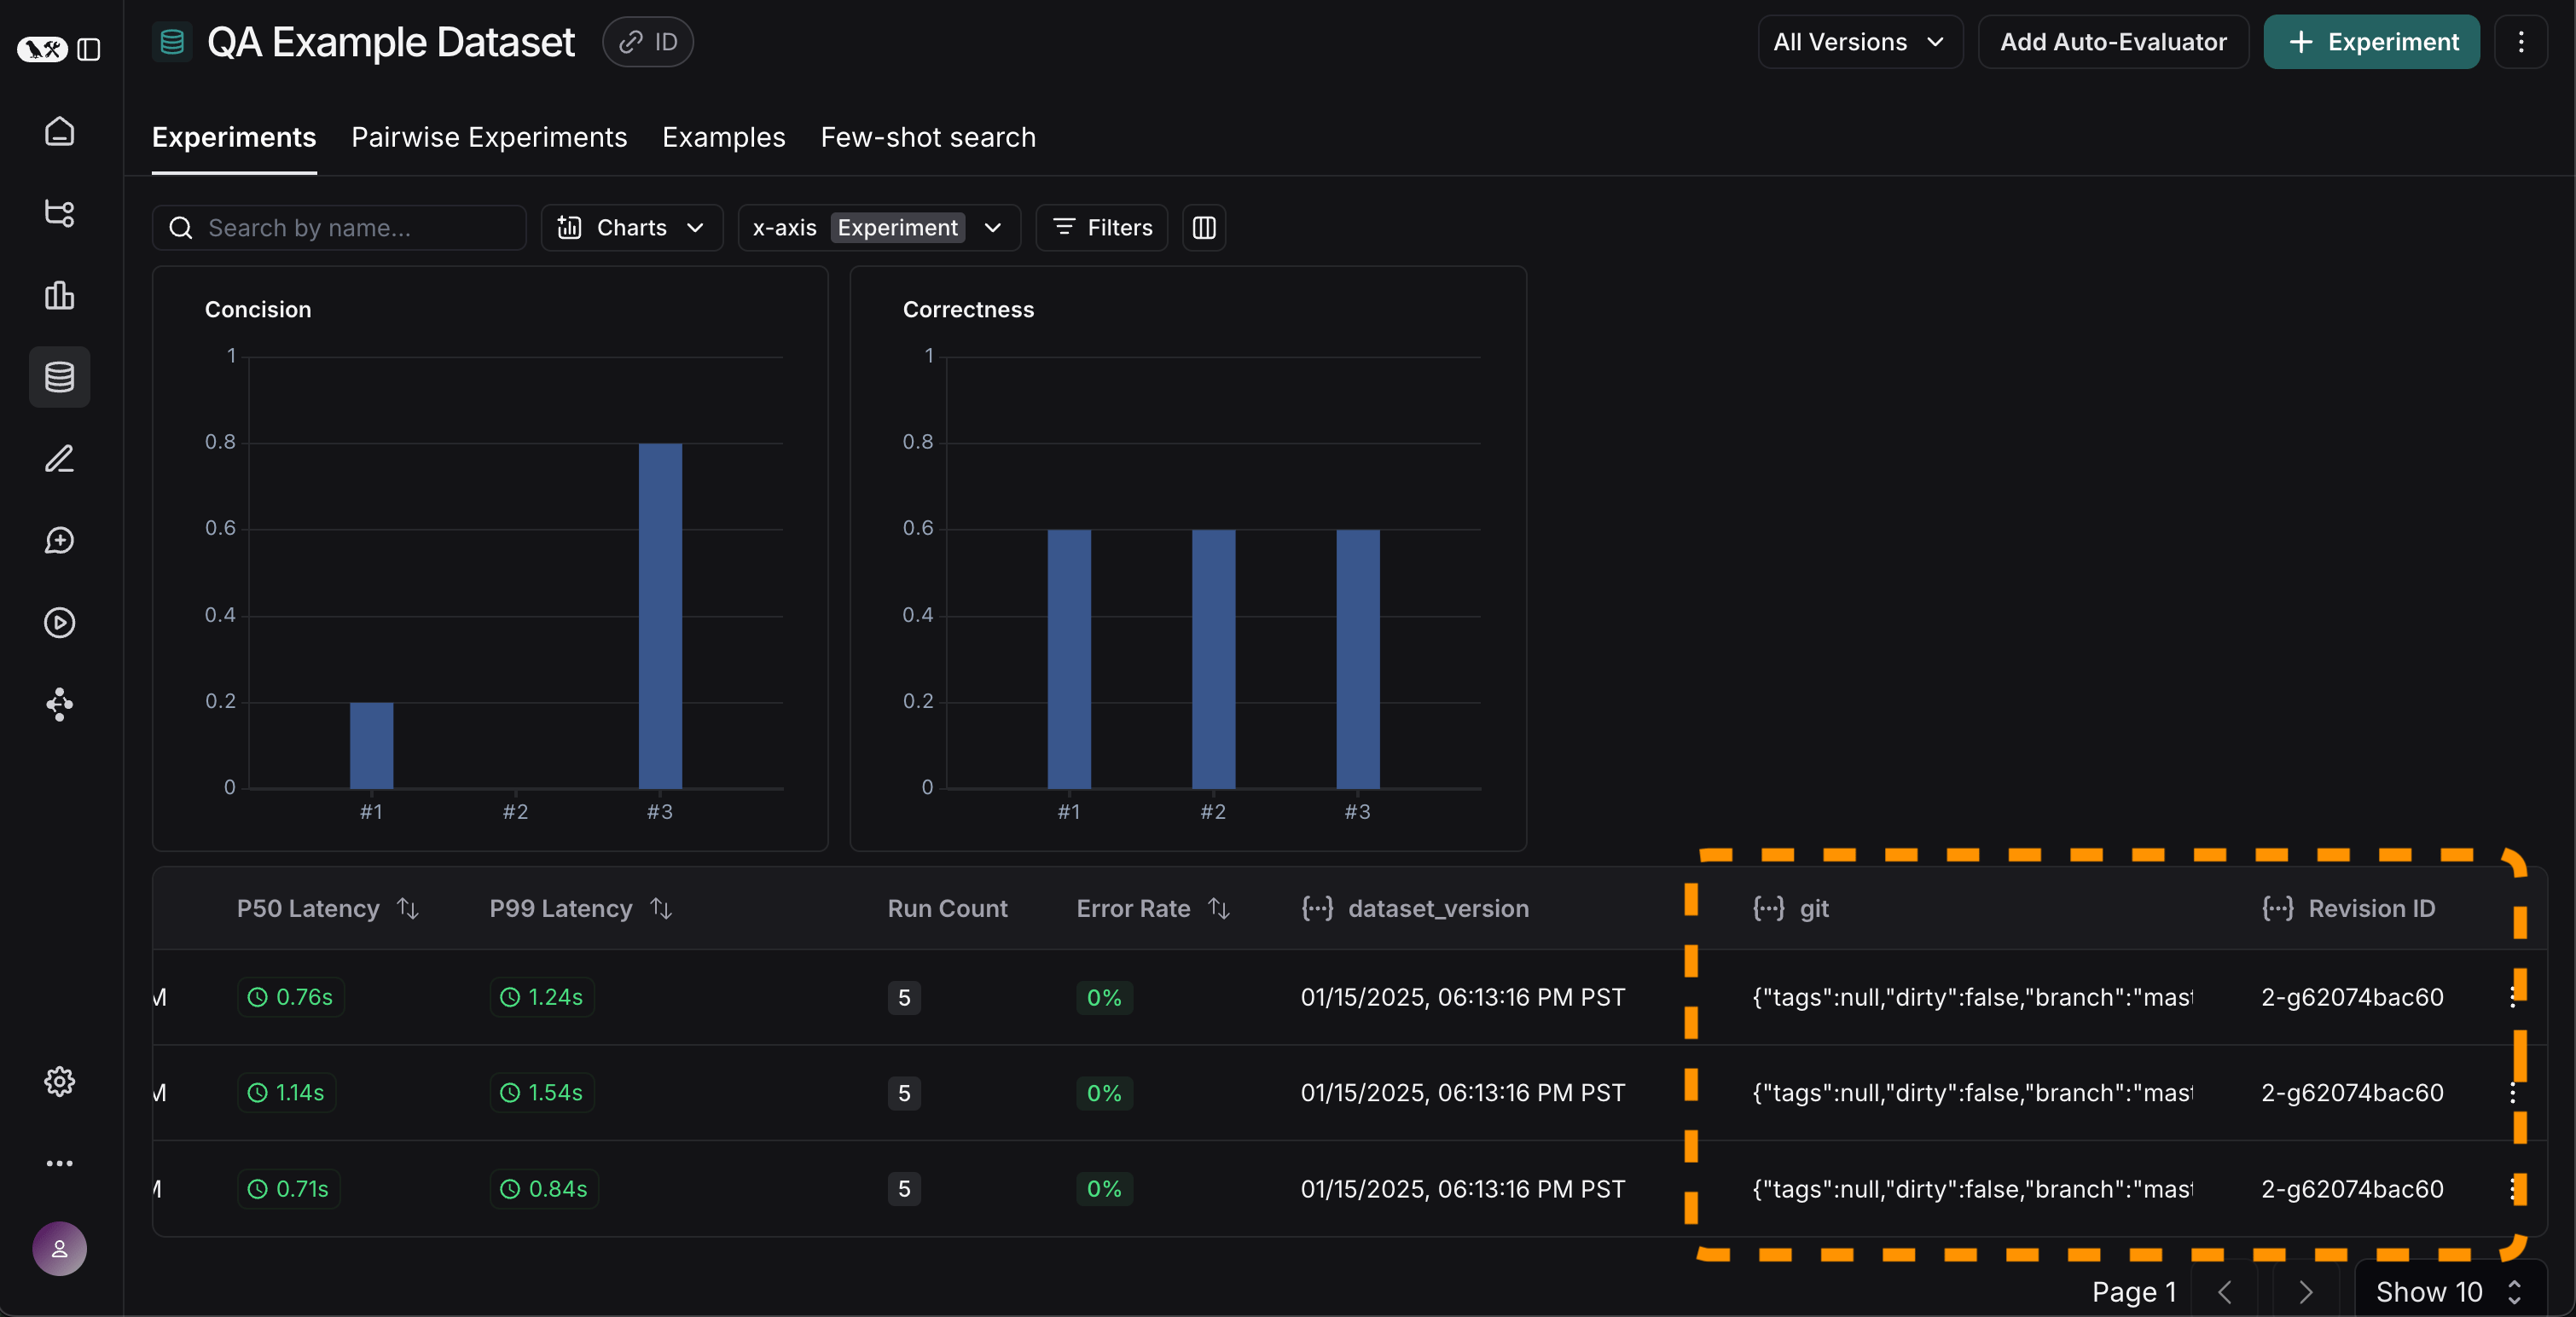
Now that we’ve got these experiments running in an automated fashion, we want to track these results over time. We can do this from the overallExperiments tab in the datasets page. By default, we show evaluation metrics over time (highlighted in red). We also automatically track git metrics, to easily associate it with the branch of your code (highlighted in yellow).
Conclusion
That’s it for this tutorial! We’ve gone over how to create an initial test set, define some evaluation metrics, run experiments, compare them manually, set up CI/CD, and track results over time. This can help you iterate with confidence. This is just the start. As mentioned earlier, evaluation is an ongoing process. For example - the datapoints you will want to evaluate on will likely continue to change over time. There are many types of evaluators you may wish to explore. For information on this, check out the how-to guides. Additionally, there are other ways to evaluate data besides in this “offline” manner (e.g. you can evaluate production data). For more information on online evaluation, check out Set up LLM-as-a-judge online evaluators.Reference code
Click to see a consolidated code snippet
Click to see a consolidated code snippet
Connect these docs to Claude, VSCode, and more via MCP for real-time answers.